Italy’s ailments under the OECD’s microscope
15.02.17
Why does Italy rank 32nd out of 35 on the Wake Up 2050 Index while Sweden ranks 2nd?
Recent prejudices might suggest that the reason is that one is in southern Europe and the other is in the north, but we should remember that in 1991 both countries faced a financial crisis, both had bloated, unsustainably large public sectors, and both had spent much of the previous 20 years using periodic devaluations to rescue their industry from a chronic lack of competitiveness. But a quarter century on from its crisis, Sweden has restored its prosperity and financial sustainability, and is well prepared for 21st century forces. Italy is not.
In its latest survey of Italy’s economy, released on February 15th, the OECD has done a fine job both of describing the differences and of explaining them. Its story is best shown through its charts.
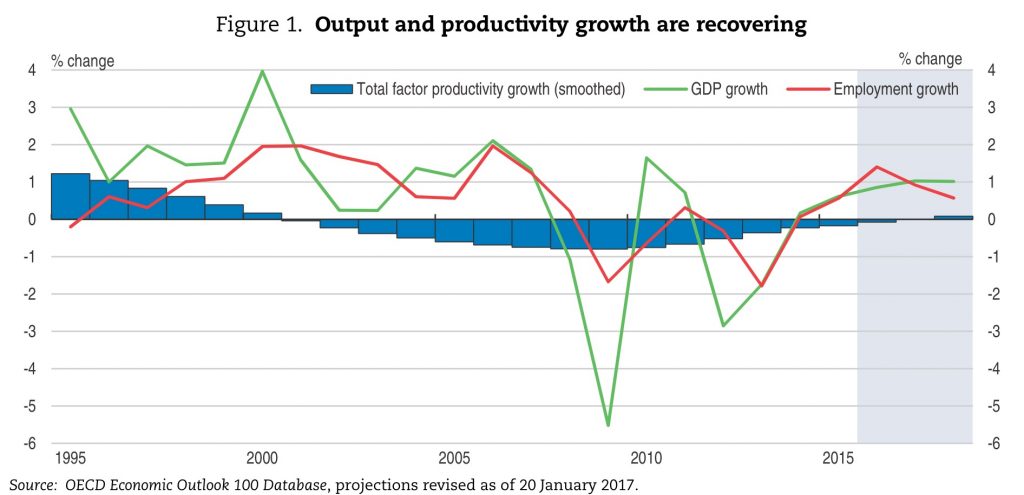
Somewhat diplomatically, the OECD observes that Italy’s economy is recovering – which is true, but it is growing a lot more slowly than other Eurozone countries, and too anaemically to yet have any noticeable beneficial impact on the country’s three great weak spots: household incomes, public debt (133% of GDP) or banks’ burden of non-performing loans. Most OECD countries have had weak or no productivity growth since the 2008 crisis, but Italy’s productivity performance is particularly poor.
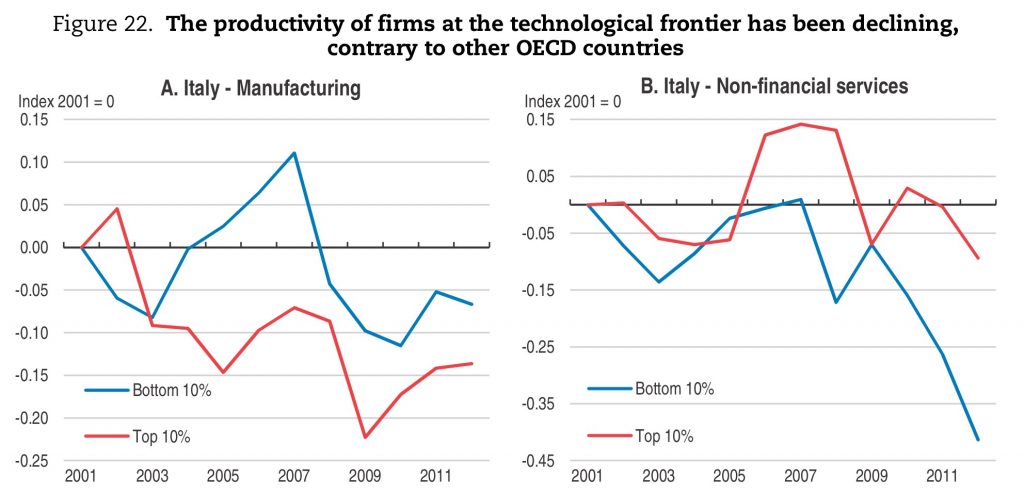
In most other OECD countries, such poor overall productivity performance masks a growing gap between firms at the frontier of technology, which are doing well, and the many laggards. Not in Italy, where as the OECD’s chart shows productivity has also fallen even at the most productive companies, those closest to the technological frontier.
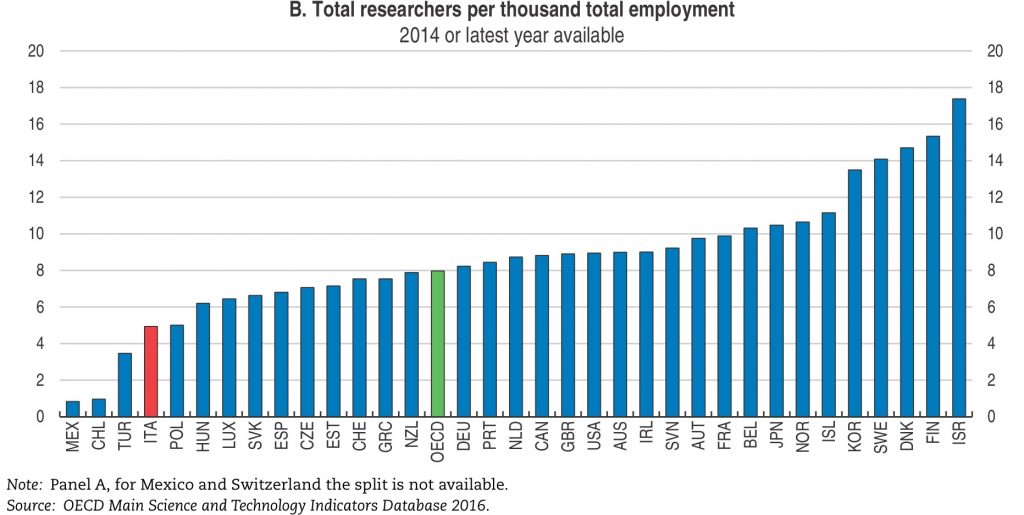
Italy used to be known for its innovation both in science itself and in business models. Now, however, its organisations employ fewer researchers than others.
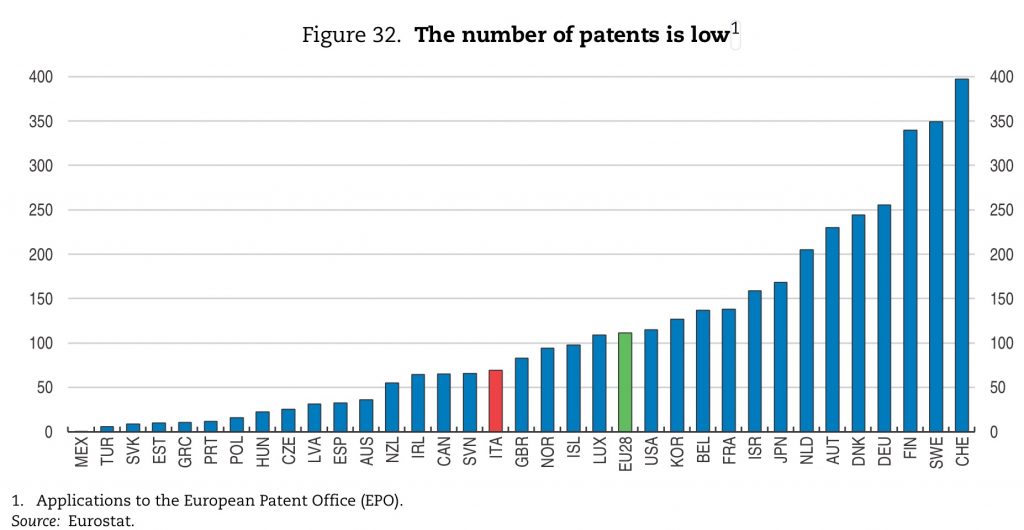
And not surprisingly Italians are not big filers of patents (though perhaps a bit more than you might expect given the number of researchers).
Low levels of business investment and spending on research & development are other explanations. Moreover the Italian education system does a poor job, compared with other rich OECD countries, in building literacy. Italy has trapped itself in the vicious cycle from which Sweden, thanks to its 1990s reforms to public finances and to the business environment, has escaped: unable to reduce public debt and committed to spending well over 15% of GDP on public pensions, Italy correspondingly has scant room to spend more on education, skills or scientific research. It educates girls at least as well as it does boys, indeed arguably better, but a low level of female participation on the labour force – 57%, compared with 80% in Sweden and 70% in Britain – limits the extent to which that education contributes to productivity and wealth.
The most telling overall explanation for Italy’s weaknesses can be found in two other charts in the OECD report. The organization praises the country for having a relatively low level of what it calls “product market regulation”, namely the sort of red tape than can hinder commerce. But it then notes that on the World Bank’s overall ranking of how easy it is to do business in countries, which takes in the justice system, ease of making start-ups and the raising of finance, and other factors, Italy scores poorly.
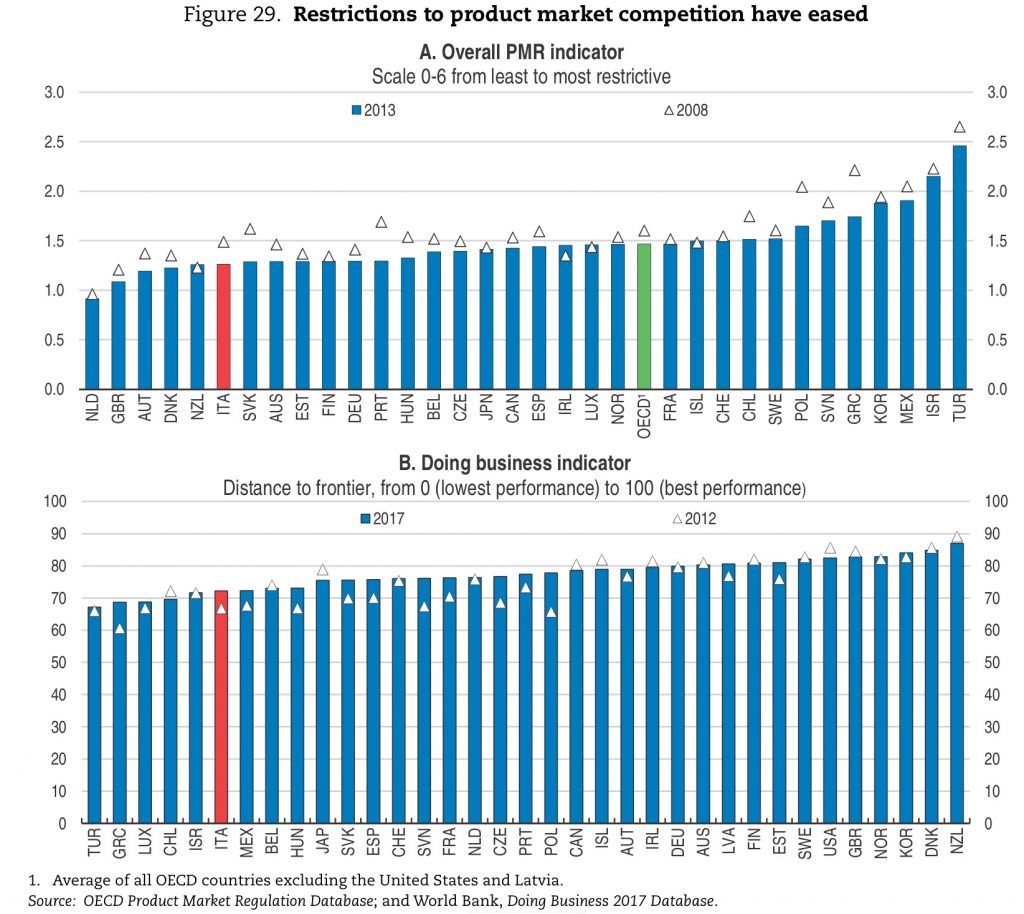
Italy simply makes it hard to do business by placing lots of obstacles in the way.
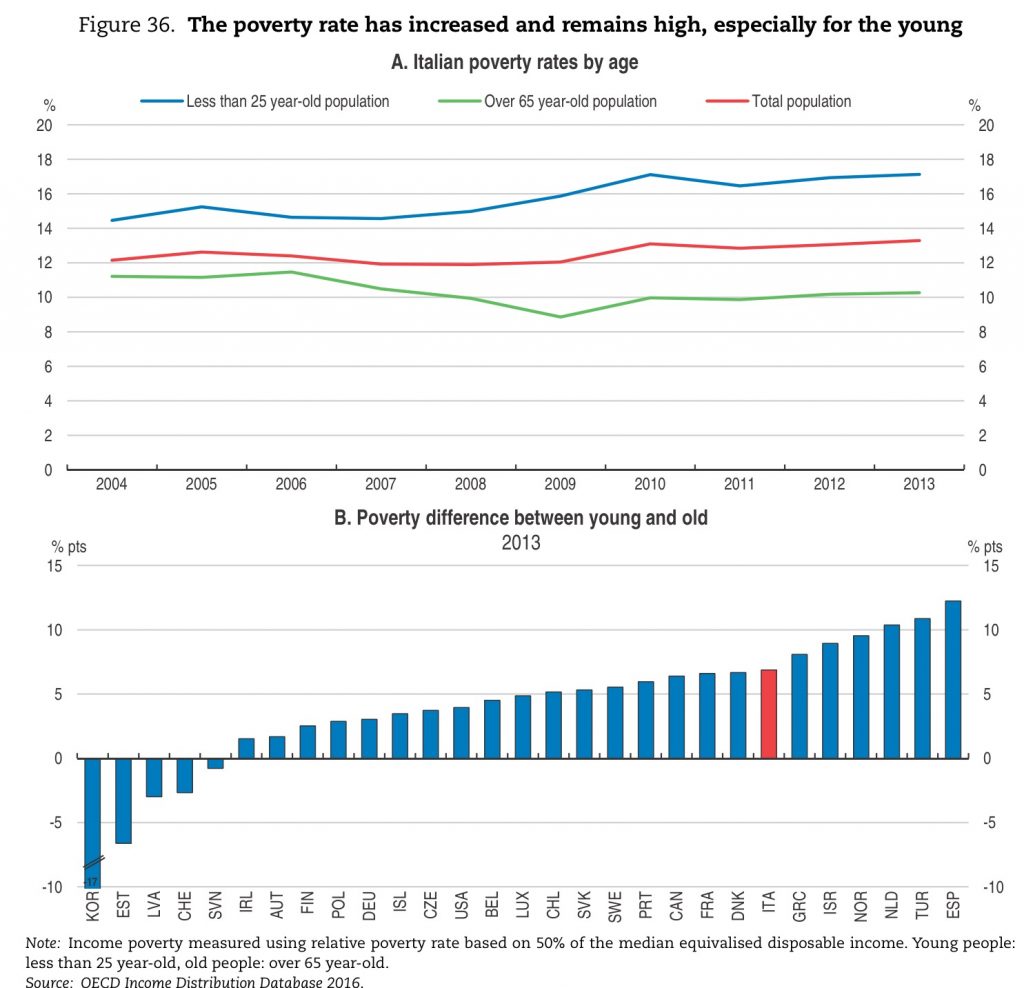
The results of all these weaknesses will, if they are not addressed, be seen even more extensively over coming decades as the country’s ageing demography weighs ever more heavily. It is sometimes said that whatever their difficulties, Italians always know how to survive and to live well. But the evidence for that notion is looking thinner and thinner. Poverty rates have risen steadily. In the past, poverty would have been greatest among the old. Now, it is greatest among the young.
No wonder the anti-establishment Five Star Movement scores especially well among the young.
- Overall:
- Demography:
- Knowledge:
- Innovation:
- Openness:
- Resilience: